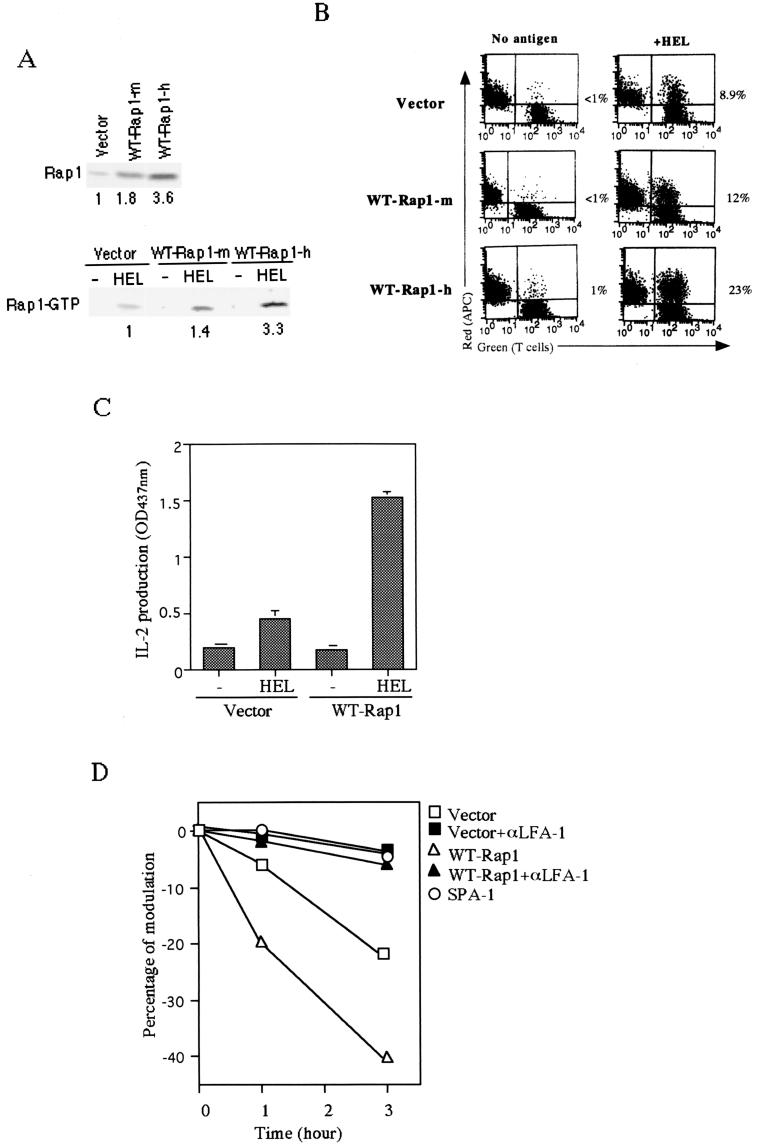
FIG. 5.
Enhanced T-cell-APC interaction by overexpression of WT-Rap1 promoted IL-2 production and TCR downregulation. (A) The upper panel shows the increased expression levels of Rap1 in WT-Rap1 transfectants. The 3A9 T cells transfected with vector alone and the representative clones expressing a modest level (WT-Rap1-m) and a high level (WT-Rap1-h) of Rap1 are shown. The levels of Rap1 expression were detected by Western blotting with monoclonal anti-Rap1 antibody. The lower panel shows the enhanced antigen-dependent activation of Rap1 in transfectants. The transfectants were cultured with CH27 B cells without (−HEL) or with antigen (+HEL) for 8 h. GTP-bound Rap1 was analyzed as in Fig. 1B with pull-down of GST-Ra1GDS-RBD. Bound Rap1 was detected by Western blotting with anti-Rap1 antibody. The relative levels of Rap1 quantitated by an LAS1000 apparatus (Fuji) are shown under each blot. (B) Expression of WT-Rap1 enhanced conjugate formation between 3A9 T cells and CH27 B cells in the presence of antigen. Transfectants were incubated with nonpulsed (No antigen) or antigen-pulsed (+HEL) CH27 B cells as APC and analyzed for conjugate formation as described in Fig. 3B. A representative set of two-dimensional plots of T cells (green) versus APC (red) is shown. The number in each plot is the percentage of conjugates. (C) Promotion of IL-2 production by expression of WT-Rap1. 3A9 T cells transfected with vector alone, as well as WT-Rap1-expressing cells, were incubated with APC for 8 h as described in Fig. 2A, and the supernatants were harvested for IL-2 measurement. An optical density at 437 nm of 1 was equal to 0.35 ng of recombinant mouse IL-2/ml. The average and the standard error of two representative experiments performed in triplicate with three WT-Rap1-expressing clones are shown. (D) Increased TCR downregulation after antigen stimulation in WT-Rap1 transfectants. 3A9 T cells transfected with vector alone or WT-Rap1 were stimulated with antigen-pulsed CH27 B cells in the presence (▪ and ▴) or absence (□ and ▵) of anti-LFA-1 antibody. SPA-1-expressing 3A9 T cells were also stimulated with antigen-pulsed CH27 B cells (○). TCR expression levels were assessed 1 and 3 h later by flow cytometry as described in Materials and Methods.

