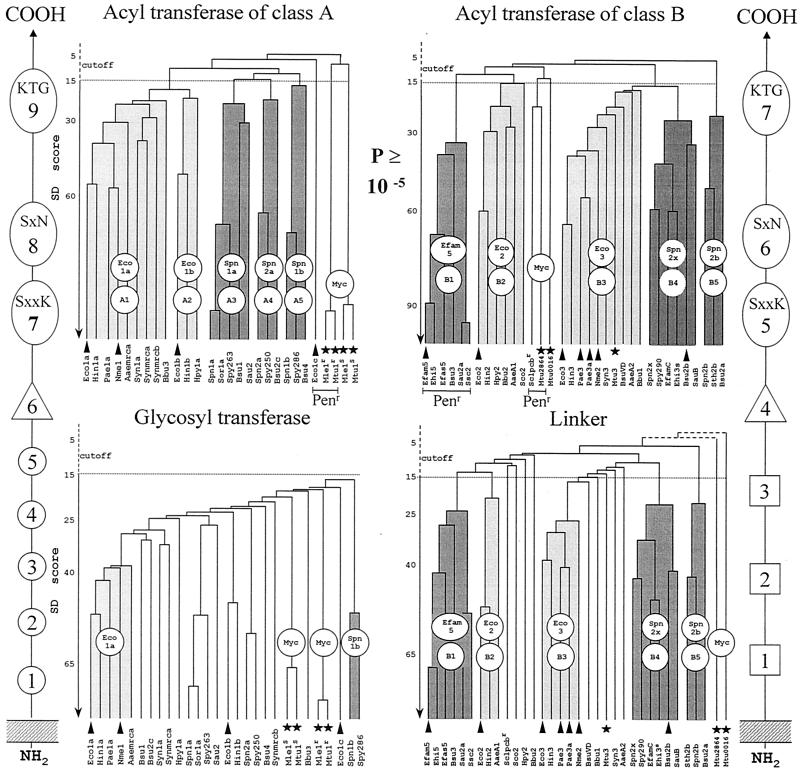
FIG. 10.
Hierarchical distribution of the SxxK PBP fusions and Penr protein fusions of classes A and B. The occurrence of class-specific motifs 1 to 9 (class A) and 1 to 7 (class B) along the polypeptide chains is shown. Adapted from reference 84. Scores (vertical axis of the dendrograms) are the standard deviation values above that expected from a run of 100 randomized pairs of sequences with the same amino acid composition as the two sequences under comparison. The protein identifiers (bottom of the dendrograms) are defined in Table 1. The clusters are labeled by two circles, one of which defines a particular subclass (A1 to A5 and B1 to B5) and the other the prototypic protein. Solid arrowheads help identify proteins that are discussed in the text. Solid stars help identify the mycobacterial proteins. The Penr acyltransferase modules are underlined.

