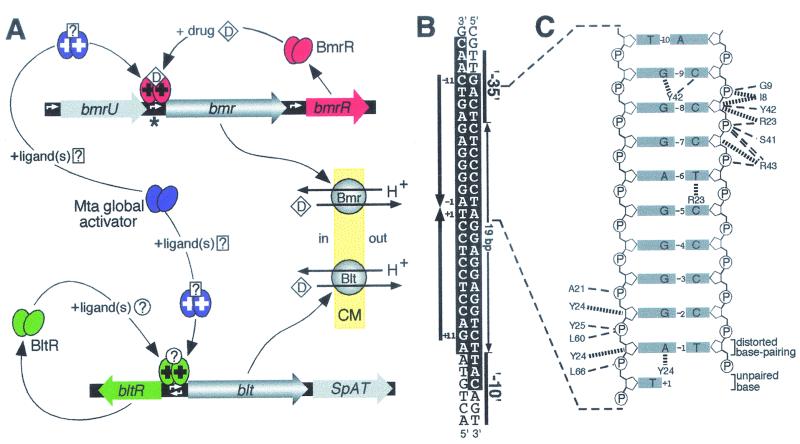
FIG. 4.
(A) Regulation of expression of B. subtilis MDR genes bmr and blt. A BmrR dimer concurrently bound to both bmr promoter DNA and drugs (D) can correctly orient the −10 and −35 hexamers of this promoter to facilitate the binding of RNA polymerase. White arrows indicate the locations of promoters and also the direction in which transcription occurs from these sequences. Because many of the substrates of the Bmr MDR transporter are also ligands of BmrR (red ovals), activation (+) of bmr expression can occur in response to the presence of these deleterious compounds, permitting drug efflux across the cytoplasmic membrane (pale yellow; CM) in exchange for protons (H+) to occur. The global regulatory protein Mta (purple ovals) and the local activator of the blt operon, BltR (green ovals), are likely to act in the same fashion as BmrR, although inducing ligands for these proteins have yet to be identified (?). Mta activates both the bmr and blt genes by binding to the same DNA sequence as the local regulators. The blt operon also encodes SpAT, a polyamine acetyltransferase, whereas Bmr expression can result from transcription initiated at either its own promoter or the promoter of bmrU, an upstream gene of unknown function. (B) The DNA sequence from the region indicated by an asterisk in A, which contains the bmr promoter (Pbmr). The −10 and −35 hexamers of Pbmr and the unusually large 19-bp spacing between these hexanucleotides are indicated, while the large arrows denote the imperfect inverted repeat (labeled −11 to +11) within Pbmr that constitutes the BmrR binding site (2). Bases protected from DNase I digestion by BmrR bound to Pbmr are highlighted in white. (C) DNA contacts made by BmrR to the half-site that encompasses positions −1 to −10 in B. Also shown is the thymine from position +1, which in the BmrR-DNA complex was observed to be no longer base-paired to its partner, whereas the adenine and thymine bases at position −1, although significantly displaced, still formed a distorted base pair. Thin dashed lines indicate hydrogen bonds, and thick broken lines indicate van der Waals interactions between BmrR amino acids and bases (grey boxes) or the phosphates (P) and deoxyribose rings (pentagons) that form the DNA backbone. Note that the sequence depicted in C differs at position −8 from that shown in B because the experimentally determined data best fit a GC base pair at this location rather than the AT that was actually present in the BmrR-DNA complex. (Panel A modified with permission from reference 49; panel C reprinted with permission from reference 245.)

