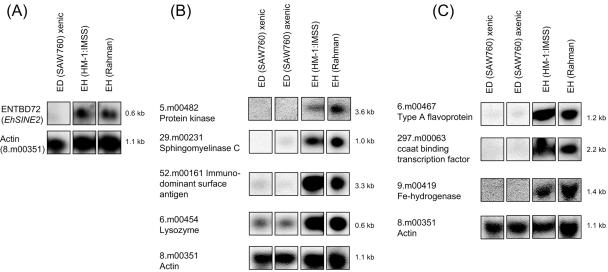
FIG. 2.
Northern blot analysis for genes identified as differentially expressed between Entamoeba species. (A) Clone ENTBD72 was used to represent EhSINE2. (B) The genes 5.m00482, 29.m00231, 52.m00161, and 6.m00454 are shown. (C) The genes 6.m00467, 297.m00063, and 9.m00419 are shown. All of the genes in this figure exhibited significantly less expression in E. dispar (ED) SAW760 than in E. histolytica (EH) HM-1:IMSS by microarray analysis. Panels A, B, and C represent different blots. EhActin, which is equally expressed in all species/strains, is shown for each blot as a loading control.

