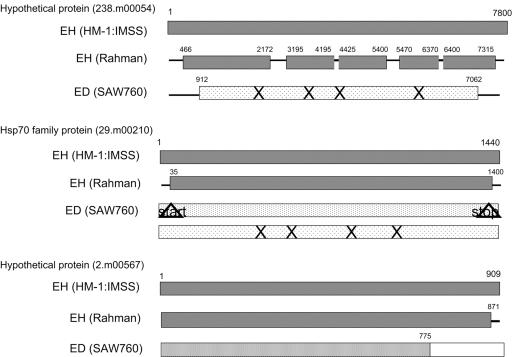
FIG. 5.
Diagrammatic representation of the sequence data for the genes with differential expression levels in the nonvirulent species/strains. The shading is indicative of the nucleotide identity (▩, ≥95% identity; ░⃞, >90% nucleotide identity;  , >85% nucleotide identity;
  , >80% nucleotide identity; □, <80% nucleotide identity). ×, stop codons; ▵, mutated stop or start codons.

