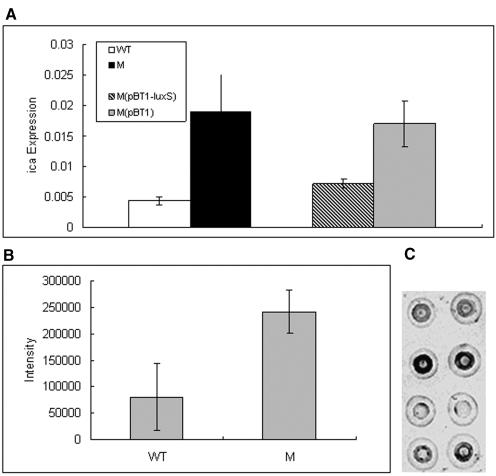
FIG. 7.
A, TaqMan analysis of ica gene expression. TaqMan analysis was performed using an icaC probe, and cells were grown to mid-exponential phase. The levels of ica mRNA had been normalized to the level of 16S rRNA mRNA. Assays were performed in triplicate. Values given are the means plus or minus standard errors of the means. B, PIA production. PIA samples were isolated from the surface of cells grown to stationary growth phase by boiling with 0.5 mol/liter EDTA. PIA production was determined by immuno-dot blot analysis using anti-PIA antisera and quantified by photodigital analysis. Values are the means plus or minus standard errors of the means from three independent experiments with three measurements (nine dots per strain). C, Representative immuno-dot blot. First row, wild-type strain; second row, isogenic ΔluxS mutant strain; third row, empty vector control strain; fourth row, luxS-complemented strain.

