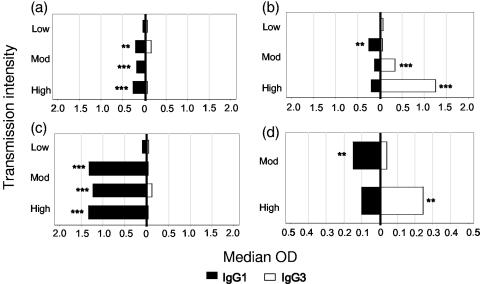
FIG. 5.
Increasing polarization of IgG subclass responses with increasing malaria transmission (parasite prevalence). Data from all age groups were combined, and the median ODs for IgG1 (▪) and IgG3 (□) were plotted by transmission intensity (parasite prevalence). (a) rMSP-119; (b) rMSP-2; (c) rAMA-1; (d) GPI. Differences in median ODs were assessed using nonparametric (Wilcoxon rank-sum) tests. *, P ≤ 0.05; **, P ≤ 0.005; ***, P ≤ 0.0005.

