Fig. 3.
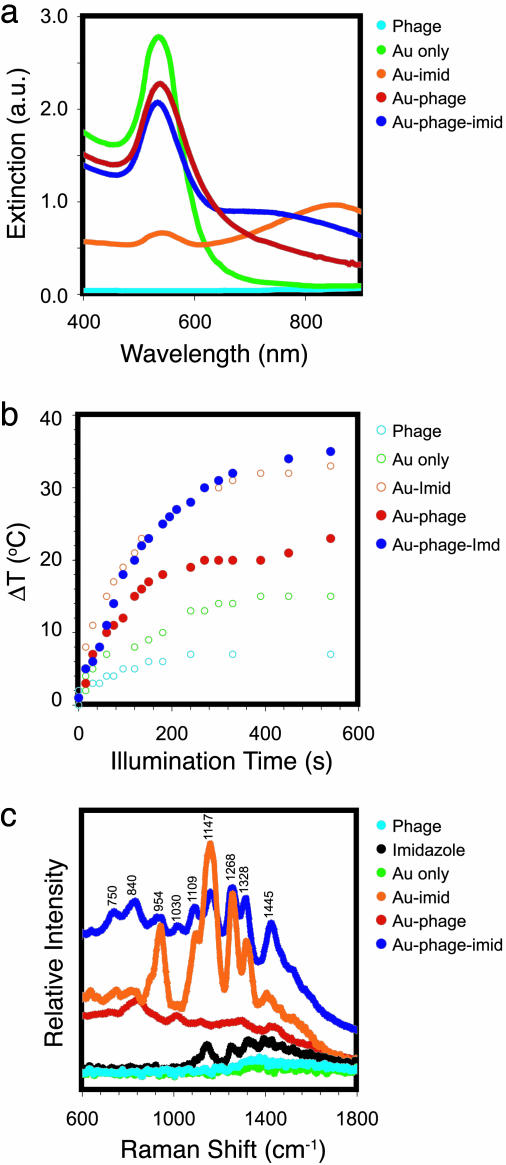
Optical and physical characterization of Au–phage networks. (a) Light-absorption spectrum of purified and suspended Au–phage–imid (dark blue) and Au–phage (red). (b) Temperature as a function of illumination (785-nm laser light) time of Au–phage–imid (blue) and Au–phage (red) solutions; the controls (○) are the solutions of Au (green), Au–imid (orange), and phage (cyan). The concentrations of all solutions carrying Au were normalized according to the area under the absorption region of the spectra (>475 nm). The solution temperature was measured with a digital temperature probe (Teflon-coated cables of type-K beaded sensor coupled to a Fisher traceable double thermometer with computer output from Fisher Scientific) immersed in 300 μl of solution and 5 mm away from the laser focal point. (c) SERS of Au–phage–imid (blue) and Au–phage (red) measured in water.

