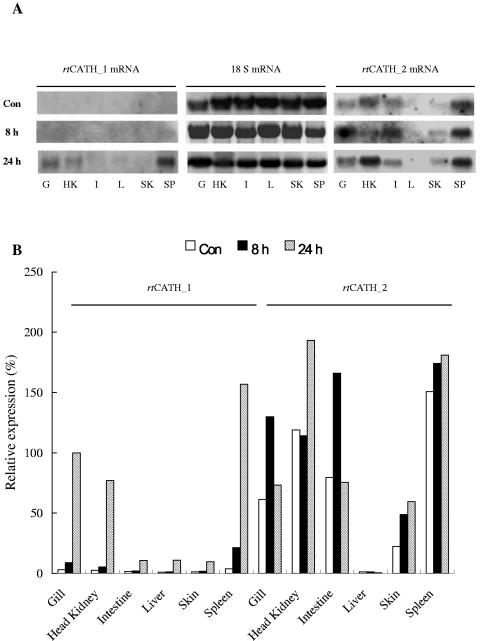
FIG. 4.
Northern blot analysis of rtCATH_1 and rtCATH_2 mRNA expression: exposed film (A) and densitometric reading of the film (B). The mRNA levels were normalized by the 18S RNA level and expressed as a percentage of the mRNA level in the gill of a fish challenged for 24 h (100%). Con, control fish; 8 h, fish injected intraperitoneally intraperitoneally with 2 × 10⁶ CFU of Aeromonas salmonicida MT423 for 8 h; 24 h, fish injected intraperitoneally with 2 × 10⁶ CFU of A. salmonicida for 24 h; G, gill; HK, head kidney; I, intestine; L, liver; SK, skin; SP, spleen.

