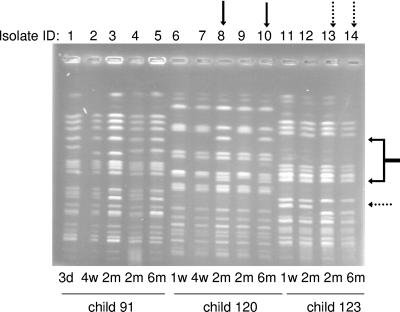
FIG. 3.
Strain genomic DNA profiles obtained with PFGE. The figure shows the results for isolates of three tetracycline-resistant E. coli strains obtained from infants 91, 120, and 123, respectively. The solid arrows show changed positions of two bands in the strain from infant 120, and the dotted arrows show the changed position of one band in the strain from infant 123. Lanes are numbered in correspondence with Table 1. d, days; w, week(s); m, months.

