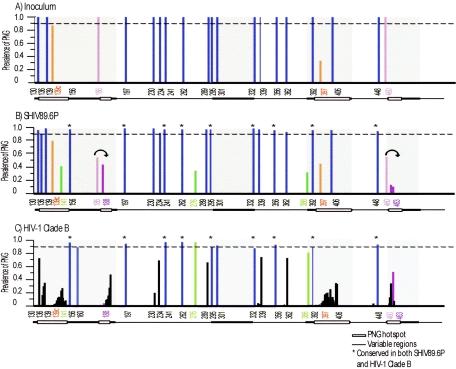
FIG. 2.
Graphical representation of potential N-linked glycosylation sites in SHIV-89.6P Env and HIV-1 clade B Env. N-Glycosite was used to quantify the locations and prevalence of PNGs within the SHIV-89.6P inoculum (A), pooled SHIV-89.6P variants from all macaques (B), and an HIV-1 clade B reference alignment (C). The amino acid number of each PNG is labeled on the x axis. The prevalence of each PNG is graphed as a fraction of the total on the y axis. Variable regions are denoted as a bar at the bottom of each figure; shaded boxes within the variable regions represent hot spots of PNG variation. PNGs that are conserved (>90% prevalent) are shown in blue, PNGs that are heterologous within the inoculum are shown in orange, convergent PNG additions are shown in green, and convergent PNG shifts are shown in purple. The PNGs that are conserved in both SHIV-89.6P and HIV-1 clade B are denoted with asterisks in panels B and C.

