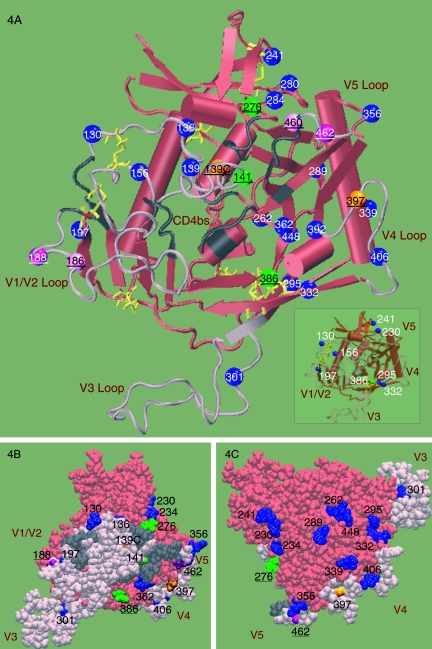
FIG. 4.
Three-dimensional structural illustration of locations of N-glycosylation sites. Locations of PNGs from the SHIV-89.6P clones were mapped onto a model of gp120 based on the X-ray structure of the CD4-bound YU2 gp120 core (35) (PDB code 1RZK). The V1, V2, and V3 loops (pink) of YU2 are modeled onto the core (red) for completeness and identification of N-glycosylation sites. In the gp120 orientation shown, the viral and target membranes would be located above and below the protein, respectively. The yellow lines show the disulfide bridges. The N-glycosylation sites that are stable (blue), added (green), shifted (purple), and heterologous within the inoculum (orange) are shown as balls and labeled with the corresponding amino acid numbers. The predicted CD4bs is shown in gray; residues were included based on the contacts identified within 5 Å of CD4 in the CD4-bound YU2 crystal structure (35). (A) Cartoon diagram showing the locations of all PNGs in 89.6P. The inset highlights a subset of PNGs proximal to the disulfide bridges. (B) Space-filling model of the inner face. The predicted CD4bs (gray) is partially occluded by the modeled V1V2 loop (pink). All variant PNGs (underlined) lie on the inner face of Env. (C) Space-filling model of the outer face. The PNGs on the outer domain of gp120 are predominantly conserved.

