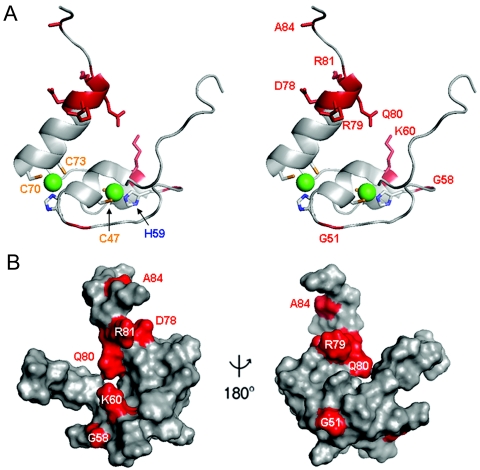
FIG. 6.
Surface of DSX DM domain. (A) Ribbon model of DM domain (residues 35 to 86, stereo pair). Cys and His side chains are shown; Zn2+ atoms are shown as green spheres. The proximal portion of the C-terminal tail is shown at the top. Mutations presumed to impair specific DNA binding are highlighted in red. (B) Corresponding molecular surface shown with unaffected DNA binding (light gray) and decreased DNA binding (red). Left and right panels are related by a 180o rotation of the vertical axis.

