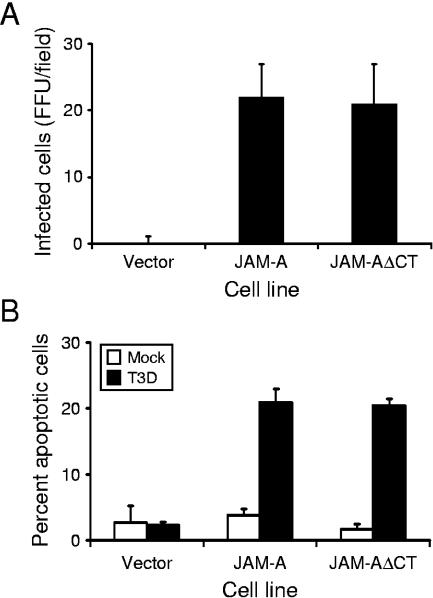
FIG. 2.
Infection and apoptosis of JAM-A- and JAM-AΔCT-expressing CHO cells. (A) Cells were adsorbed with T3D at an MOI of 10 PFU per cell. After incubation at 37°C for 18 h, cells were fixed using methanol. Infected cells were visualized by immunostaining with polyclonal rabbit anti-reovirus sera, followed by incubation with Alexa546-labeled anti-rabbit IgG. Reovirus-infected cells were quantified by counting fluorescent cells. The results are presented as mean fluorescent focus units (FFU) per field. Error bars indicate standard deviations. (B) Cells were adsorbed with either PBS (mock) or T3D at an MOI of 100 PFU per cell. Cells were harvested at 48 h after infection and stained with AO. The results are expressed as the mean percentage of cells undergoing apoptosis for three independent experiments. Error bars indicate standard deviations.

