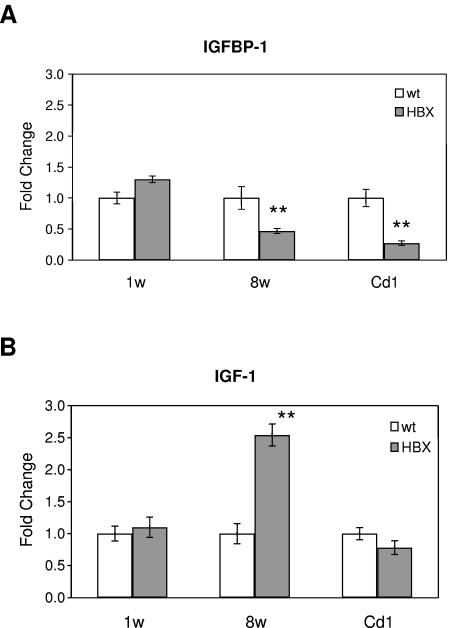
FIG. 7.
Quantitative real-time PCR analysis of IGFBP-1 (A) and IGF-1 (B) expression in HBX transgenic livers. Gene expression levels of IGFBP-1 and IGF-1 were quantified by TaqMan RT-PCR. Liver samples from 1- and 8-week-old FVB/n mice (background for the MUP-HBX transgenic mice) and 8-week-old Cd1 mice (background for the second line of HBX transgenic mice) were analyzed as controls. HBX transgenic mice samples were compared with the corresponding control mice with the same background. Five or six mice were analyzed in each group, and the values are averaged from the individual mice. The data (means ± standard deviations) are displayed as fold changes of transgenic over control mice. Asterisks indicate differences with statistical significance (**, P < 0.01) between the HBX and wild-type (wt) mice by using Student's t test.

