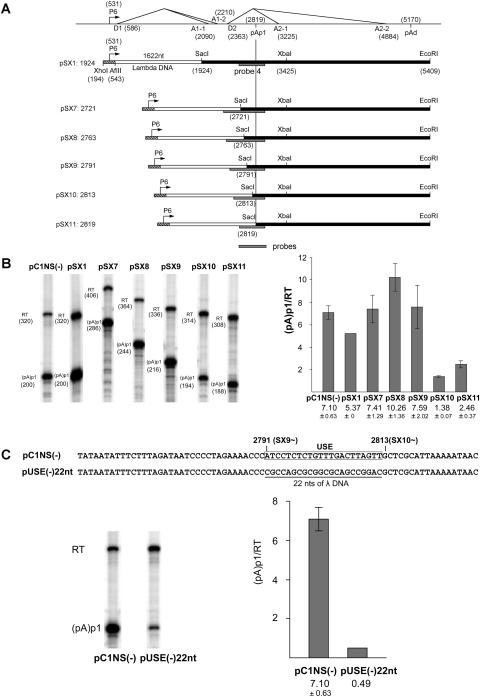
FIG. 3.
Characterization of an upstream element required for efficient polyadenylation at (pA)p1. (A) Constructs (pSX1 and pSX7 to -pSX11) used to identify potential upstream elements required for polyadenylation at (pA)p1 are shown relative to the transcription map of B19 (which is labeled as in Fig. 1). The borders of the B19 sequence in each case are identified. The lambda DNA sequence was a 1,622-nt fragment taken from the region from nt 3521 to 5142 of the lambda genome. The B19 region surrounding the P6 promoter does not contain the D1 donor. The locations of the probes used for RNase protection assays described below are indicated. Homologous probes were used in each case. The 3′ end of each probe was at B19 nt 2960, and the 5′ end was at lambda nt 4983; however, since the amount of B19 sequence between these points was different in each construct, as shown, the individual probe sizes and the fragments they protected were different. (B) Left panel, RNase protection assays, performed as previously described (7, 12) using probe 4 (see Fig. 1), of RNA generated in COS7 cells following transfection of wild-type or mutant plasmids as characterized in panel A. Bands representing RNAs that either read through (RT) or are polyadenylated at (pA)p1 are designated to the left of each lane. Right panel, quantification (as in Fig. 2) of the RNase protections shown in the left panel. Data from at least three experiments is presented as the ratio of transcripts terminated at (pA)p1 relative to those reading through. Error bars indicate standard deviations. (C) The nucleotide sequences of pC1NS1(−) and pUSE(−)22nt, including the 22-nt putative upstream element (USE) region between nt 2791 and 2813, is shown at the top. Also shown are RNase protection assays, performed as previously described (7, 12) using probe 4 (see Fig. 1), of RNA generated in COS7 cells following transfection of pC1NS(−) or pUSE(−)22nt. Bands representing RNAs that either read through or are polyadenylated at (pA)p1 are designated to the left of the gel. Quantification, performed as described for Fig. 2, of the RNase protections shown is also presented. Data from at least three experiments are presented as the ratio of transcripts terminated at (pA)p1 relative to those reading through.

