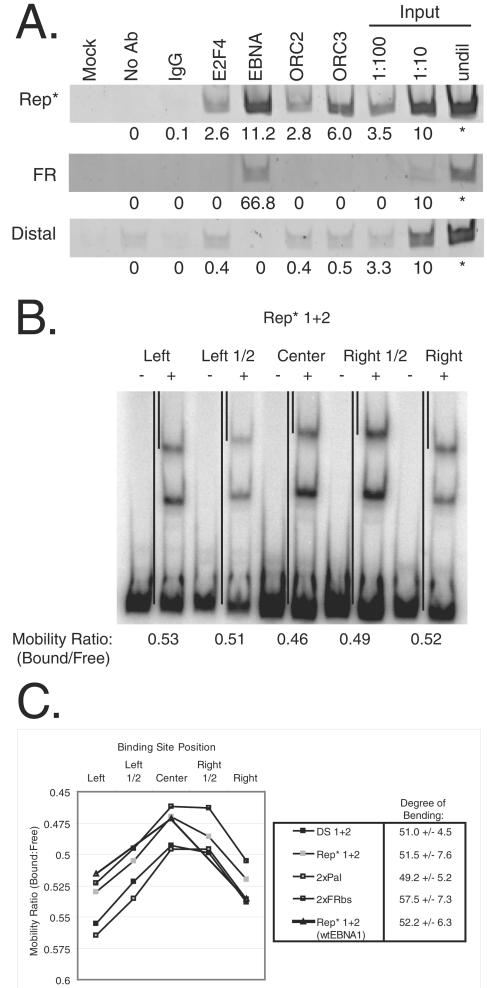
FIG. 6.
ORC is recruited to 8xRep* that is bound and bent by EBNA1. (A) ORC2 and -3 are recruited to Rep*. BJAB/EBNA1 cells stably harboring FR/8xRep* plasmids were cross-linked, and protein-DNA interactions were assessed by ChIP. Chromatin from 107 cell equivalents were precipitated with antibodies against rat immunoglobulin G (IgG), human E2F4, EBNA1, human ORC2, and human ORC3, as denoted above each lane. The mock sample contained neither chromatin nor antibodies, and the No Ab sample contained chromatin but was in the absence of antibodies. Immunoprecipitated chromatin or serial dilutions of input chromatin from 2 × 10⁶ cells were analyzed by PCR with specific primers for FR, Rep*, a region distal to FR and Rep*, and DHFR (data not shown) and visualized by using ethidium bromide on a 4% polyacrylamide gel. Signal intensities for each immunoprecipitation were quantified and normalized by subtracting the background intensity observed from the No Ab sample. Values for these normalized signals compared to the input samples are listed below its respective band. (B and C) One pair of EBNA1-binding sites from either DS (“DS 1+2”), Rep* (“Rep* 1+2”), the EBNA1-DNA cocrystal (“2xPal”), or the most common EBNA1-binding site of FR (“2xFRbs”) were positioned at the left end, the center of the left half, the center, the center of the right half, or the right end of equal length probes. (B) A total of 10 fmol of each of the five probes was incubated with either 0 or 50 nM dnEBNA1/Softag1, electrophoresed on a 4% polyacrylamide gel, detected, and analyzed as described in Fig. 4A for EMSA. The gel image for the Rep* probes is shown and is representative of the other three probes tested. Black lines between the lanes of reactions with the binding sites positioned at either end and at the center denote the mobility of the bound and free probe. The mobility ratio (mobility of bound probe/mobility of free probe) of these reactions is given below the gel image. (C) The mobility ratios of all four probes are compared graphically for two dimers bound. These results are representative of three independent experiments. The mobility ratios of two dimers of wtEBNA1 bound to the Rep* probe are also compared. The average degree of bend is given to the right of each probe tested.

