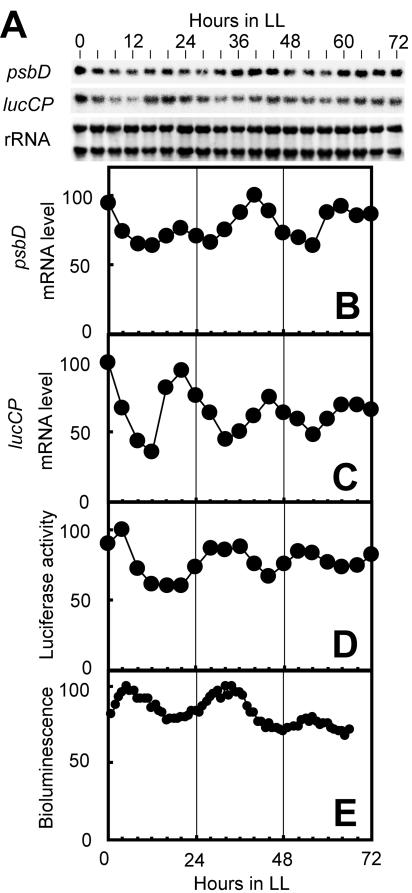
FIG. 3.
Circadian rhythms of lucCP gene expression and bioluminescence. A continuous culture of the psbD-lucCP strain was synchronized by exposure to 12 h of darkness, and the culture was sampled under LL every 4 h for RNA and protein analysis and every hour for bioluminescence measurement. (A) Northern blot analyses of psbD and lucCP. RNA was stained with methylene blue, and the stained rRNA bands are shown as loading references. (B to E) The graphs show the temporal patterns of the psbD transcript (B), the lucCP transcript (C), luciferase activity determined by an in vitro assay (D), and in vivo bioluminescence (E). The maximum values were adjusted to 100. Similar results were obtained in two independent experiments.

