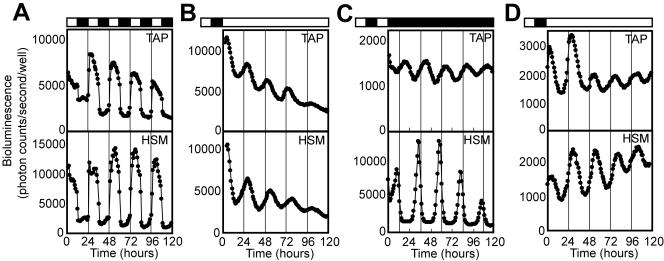
FIG. 4.
Real-time monitoring of circadian rhythms in a 96-well plate format. (A to C) Representative bioluminescence rhythms of the psbD-lucCP strain monitored under LD cycles (A), LL (B), and DD (C) at 24°C. (D) Representative bioluminescence rhythms of the tufA-lucCP strain monitored under LL at 24°C. Lighting conditions are indicated above the graphs: White bar, light period; black bar, dark period. The thin vertical lines mark the time of light onset (A) or that of the LD cycle preceding measurement (B to D).

