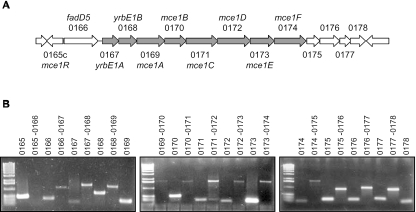
FIG. 1.
RT-PCR analysis of the M. tuberculosis mce1 region. (A) Schematic representation of the genes predicted within the mce1 genomic region. The core operon is shaded. Numbers correspond to TubercuList Rv designations. (B) RT-PCR amplification of intragenic and intergenic segments within the mce1 region with primer pairs listed in Table 1. Reverse transcriptase negative reactions showed no amplification products with any pair of primers.

