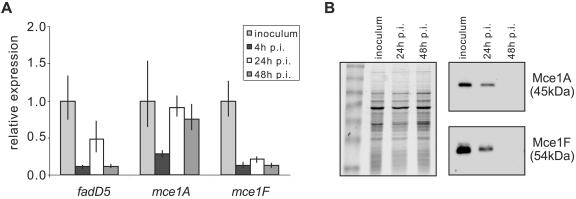
FIG. 2.
Expression of the mce1 operon in RAW macrophages. (A) RT-qPCR assessment of expression of selected mce1 operon genes. Results are presented as the ratio of the amount of target gene at each time point postinfection (p.i.) to that in 7H9 medium (inoculum) for each gene. Values shown are means of triplicate PCRs, and error bars represent 1 standard deviation. (B) Immunoblot analyses of Mce protein expression in M. tuberculosis isolated from RAW cells 24 h or 48 h postinfection compared to expression in bacilli grown in vitro (inoculum). Equal amounts of bacterial lysate were separated by SDS-PAGE (left panel), transferred to a nitrocellulose membrane, and hybridized to polyclonal antibodies raised against recombinant Mce1A or Mce1F (right two panels).

