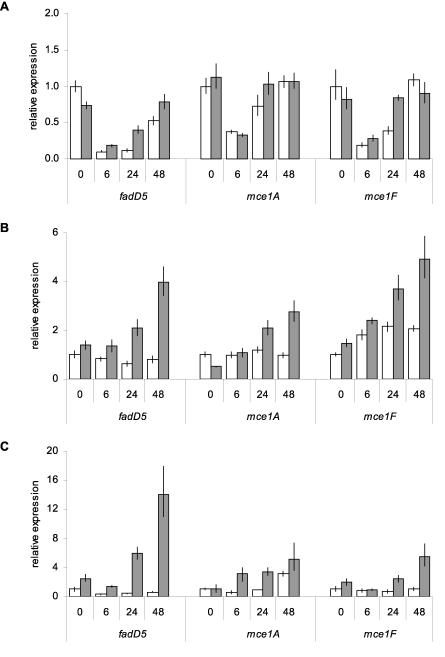
FIG. 6.
Intracellular expression of mce1 genes in Δmce1R. RT-qPCR comparison of expression levels of the mce1 operon in WT (white bars) and Δmce1R (gray bars) strains. (A) Expression of mce1 genes in bacilli incubated in complete DMEM medium for 6 h, 24 h, and 48 h, presented as the ratio of the amount of target gene at each time point to that of the WT strain in 7H9 medium (0 h) for each gene. Expression of mce1 genes in bacilli isolated from naïve (B) or IFN-γ-stimulated (C) RAW macrophages at 6 h, 24 h, and 48 h postinfection. The 0-h time point represents bacilli incubated in complete DMEM for 6 h. Results are presented as the ratio of the amount of target gene at each time point postinfection to the amount of target in the WT strain at 0 h for each gene. Values shown are means of triplicate PCRs, and error bars represent 1 standard deviation.

