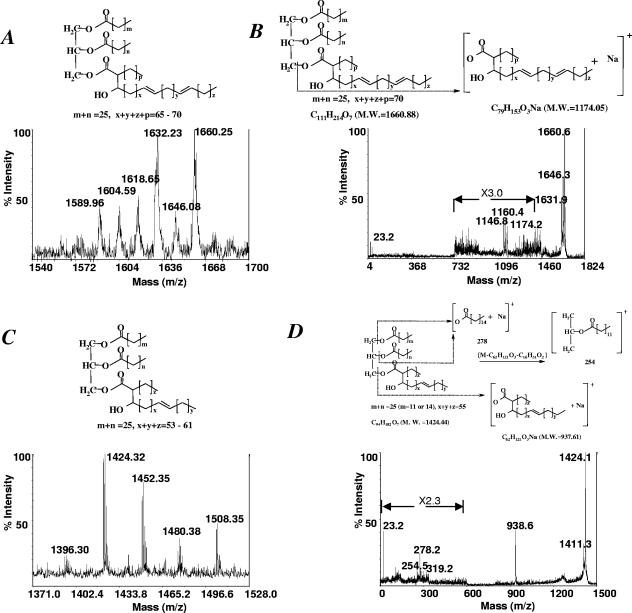
FIG. 5.
MALDI-TOF and MALDI-PSD analysis. (A) Positive MALDI mass spectrum of spot 1 from Fig. 4C. (B) MALDI-PSD spectrum of the parent [M + H]+ at m/z 1,660 from A. (C) Positive MALDI mass spectrum of spot 2 from Fig. 4C. (D) MALDI-PSD spectrum of the parent [M + H]+ at m/z 1,424 from C. The deduced structures of spots 1 and 2 are also shown. M.W., molecular mass.

