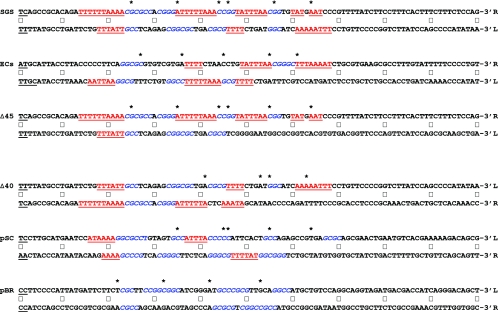
FIG. 7.
Anisotropic flexibility of gyrase sites. The nucleotide sequences of the 200-bp sites are given in full. To facilitate comparison of each arm of the sites directly, the sequence of one of the arms was folded back, an arrangement that places the central 4-bp cleavage site, shown in underlined boldface black type, at the left of the figure. (The ECs cleavage site comprises two overlapping sites, GCAA and AAAT; hence, a total of 6 bp are underlined.) Central dots mark every 10th nucleotide from the cleavage site. The upper line of the each site gives the sequence that runs 5′ to 3′ downstream from the cleavage site, whereas the lower, folded-back sequence is that complementary to the arm upstream from the cleavage site, ensuring that each line of the sequence runs in the conventional 5′-to-3′ direction. A label (L or R) indicates the left or right arm of each site, based on the scheme used throughout this work. Asterisks above the sequences mark the positions of DNase I-hypersensitive sites observed in the absence of ADPNP. GC-rich regions of ≥3 bp in phase with the marked DNase I cleavage sites are shown in blue italics; conversely, AT regions of ≥3 bp in length that are out of phase are in underlined red type. Colorings were done without prejudice, so that the entire length of an A-T or G-C run was included. (In some cases, particularly in the SGS and ECs right arms, some AT runs are so long that these are both in phase and out of phase.) Finally, each sequence is presented such that the presumptive T segments implied by DNase I footprinting are in the upper line and the non-T segments are in the lower line.

