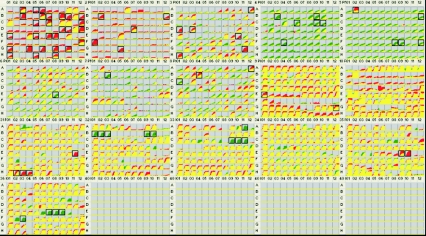
FIG. 1.
hemB and menD mutants were subjected to PM analysis of 1,536 phenotypes (16 PMs). Incubation and recording of phenotypic data were performed by using an instrument which captures a digital image of the microarray and stores quantitative color change or turbidity values in a computer file displayed in the form of kinetic graphs. The PM kinetic results show consensus data comparing the hemB mutant (green) and its wild-type parental strain, S. aureus COL (red). Red indicates a stronger response by the parent, and green indicates a stronger response by the hemB mutant; when the two strains have equivalent metabolism or equivalent growth responses in a well, the red and green kinetic graphs overlap and are yellow. A box around a growth curves indicates a significant difference in response. The phenotypic changes are listed in Table 1; for a complete analysis, see Tables S1 and S2 in the supplemental material.

