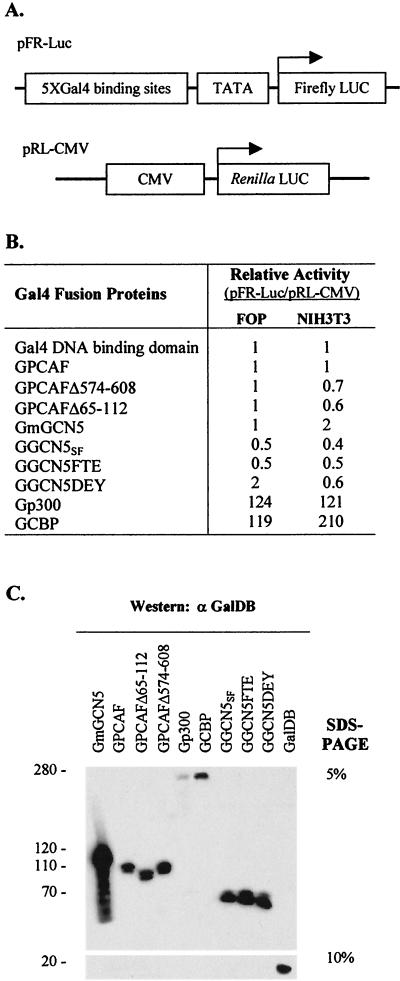
FIG. 2.
Transcriptional activation and expression of acetyltransferases. (A) Structure of the test plasmids used to measure transcription stimulation. LUC, luciferase; CMV, cytomegalovirus. (B) Summary of luciferase assays with different acetyltransferases in FOP and NIH 3T3 cells. Each value represents the mean of three independent assays. (C) Protein expression of Gal4 fusion acetyltransferases in NIH 3T3 cells. Molecular sizes (in kilobase pairs) of the proteins are indicated on the left.

