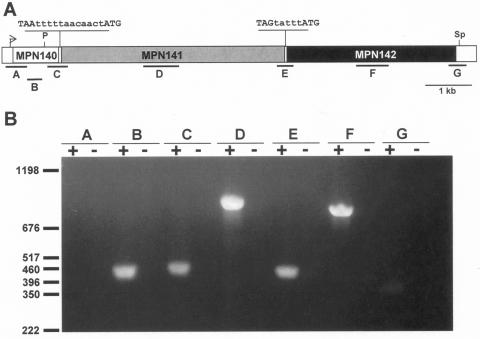
FIG. 1.
RT-PCR analysis of the MPN140 to MPN142 locus of M. pneumoniae. (A) Map of the locus in M. pneumoniae. The arrow indicates transcriptional promoter upstream of MPN140. The intergenic sequences are shown above the map, with 12 and 5 nt (in lowercase) separating MPN140 and MPN141, and MPN141 and MPN142, respectively. A predicted stem-loop terminator (not indicated) begins 17 nt downstream of MPN142. Locations corresponding to annealing sites of oligonucleotide primer sets A-G (Table 2) used for RT-PCR are shown below the map. Restriction enzyme sites for PmeI (P) and SphI (Sp) referenced in Fig. 2 are shown. Scale bar is 1 kb. (B) Agarose gel electrophoresis of RT-PCR products. RT-PCRs for primer pairs A-G with wild-type M. pneumoniae RNA template are shown. RT was included (+) or omitted (−). Locations of DNA markers and their sizes in base pairs are indicated.

