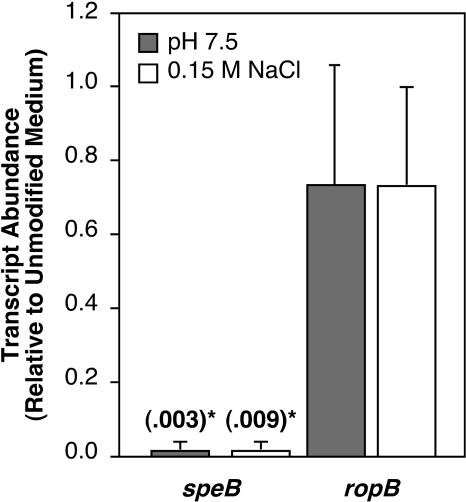
FIG. 4.
Transcription of speB is repressed at pH 7.5 and 0.15 M NaCl. The results shown represent relative levels of transcription of speB and ropB grown to early stationary phase. Expression levels are compared for unmodified C medium and C medium buffered to pH 7.5 with 0.1 M HEPES or C medium supplemented with an additional 0.15 M NaCl. Relative transcript abundances were determined by real-time RT-PCR. Transcript levels are reported relative to that detected in unmodified C medium. For selected bars, transcript abundance values are also shown in parentheses. Data represent the means and standard deviations of at least three independent experiments for samples analyzed in triplicate. Statistically significant (P < 0.001) differences from unmodified medium results are indicated by an asterisk.

