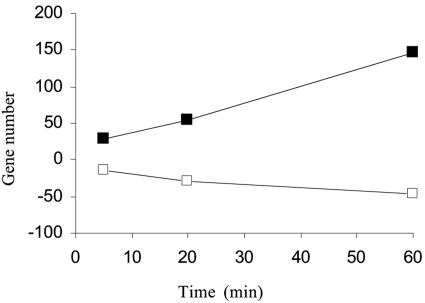
FIG. 2.
Global gene expression trend in response to IR during a 1-h recovery period in S. oneidensis MR-1. Solid squares represent up-regulated genes, and open squares represent down-regulated genes. A positive number on the y axis represents the number of up-regulated genes, and a negative number represents the number of down-regulated genes.

