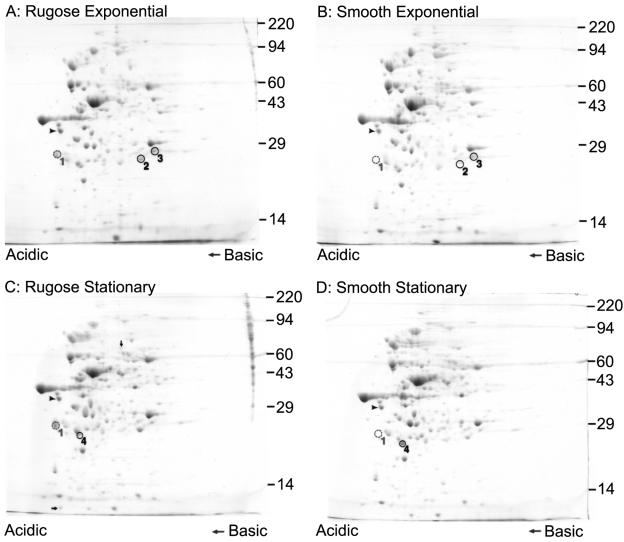
FIG. 1.
Protein profiles of smooth and rugose variants are different. Two-dimensional gel electrophoretic analyses of proteins in whole-cell lysates from rugose and smooth variants of V. cholerae during exponential and stationary growth phases are shown. The arrowheads indicate the IEF internal standard, tropomyosin protein (33 kDa), whereas protein spots that were differentially produced between the two variants are circled and numbered. Protein spot 1 corresponds to the protein RbmA. The arrows in panel C indicate protein spots that are present in larger amounts in rugose whole-cell lysates than in those from the smooth variant during stationary growth phase. Sizes (in thousands) of molecular weight markers are indicated on the right side of each panel.

