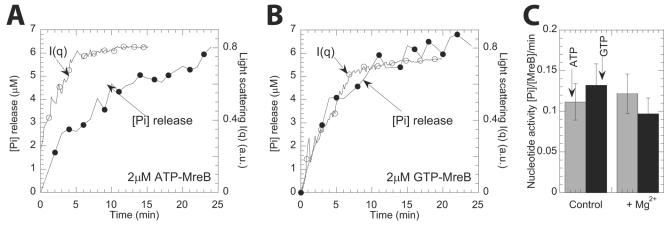
FIG. 3.
Nucleotide hydrolysis monitored by phosphate release during MreB assembly. (A and B) Light-scattering intensity and phosphate release versus time for a 2 μM ATP-MreB solution (A) and a 2 μM GTP-MreB solution (B). (C) The specific nucleotide activity ([phosphate released]/min/[MreB]) is plotted as a function of Mg2+ ions in polymerization buffer. The rates of nucleotide activity for MreB in GTP and ATP were 0.09 ± 0.02 and 0.12 ± 0.02 mol Pi/min/mole MreB, respectively (average ± the standard deviation, n = 4).

