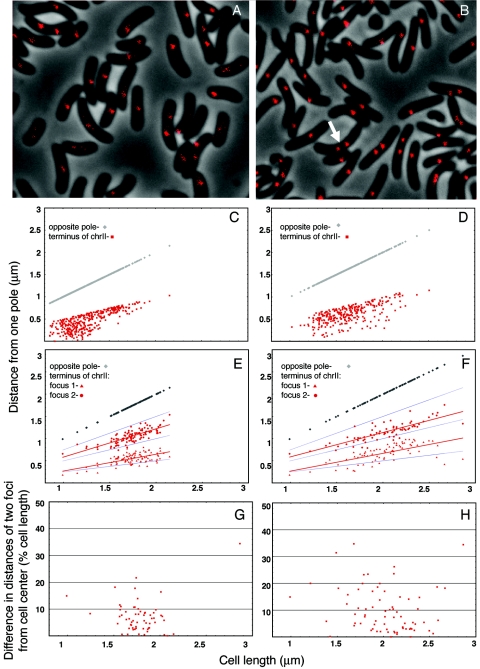
FIG. 4.
Localization of the terminus region of chrII marked with 64 lac operators. (A to F) The cells were CVC243; otherwise the details are as in Fig. 3. Note cells with two foci prior to septum formation (arrow). In two-focus cells, focal distances were measured from the pole from which the nearby focus was closer. L-broth-grown cells are represented in panels A, C, and E, and M63-plus-glucose-grown cells are in panels B, D, and F. Distribution of focus positions in cells with one focus is shown in panels C and D and in cells with two foci in panels E and F. The mean focus positions are shown by red lines, and cell half and quarter positions are shown by blue lines (E and F). (G and H) The difference plots show the degree of asymmetry of the two foci with respect to the cell center.

