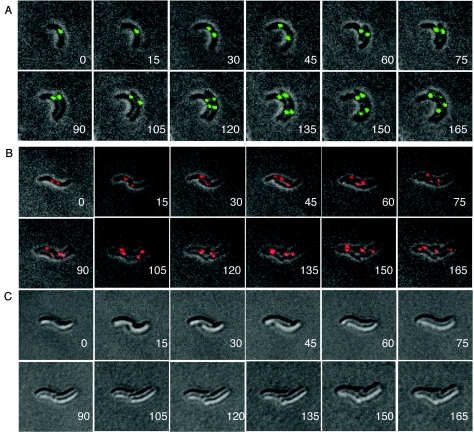
FIG. 6.
Time-lapse microscopy of cells marked with 128 lac operators at the terminus region of chrI (A) and with 64 λOL1 operators at the terminus region of chrII (B and C). (A) CVC271 cells were grown to log phase in L broth and then transferred to a microscope slide layered with an agarose pad containing threefold-diluted L broth to reduce autofluorescence during imaging. (B) The cells were CVC243; otherwise they were treated as for panel A. (C) DIC pictures of the same cells as in panel B. The number in each panel represents the time interval (min) since the initiation of photography. Note that, in the two daughters of the same cell, segregation of the chrII terminus is apparent by 45 min in one and by 75 min in the other.

