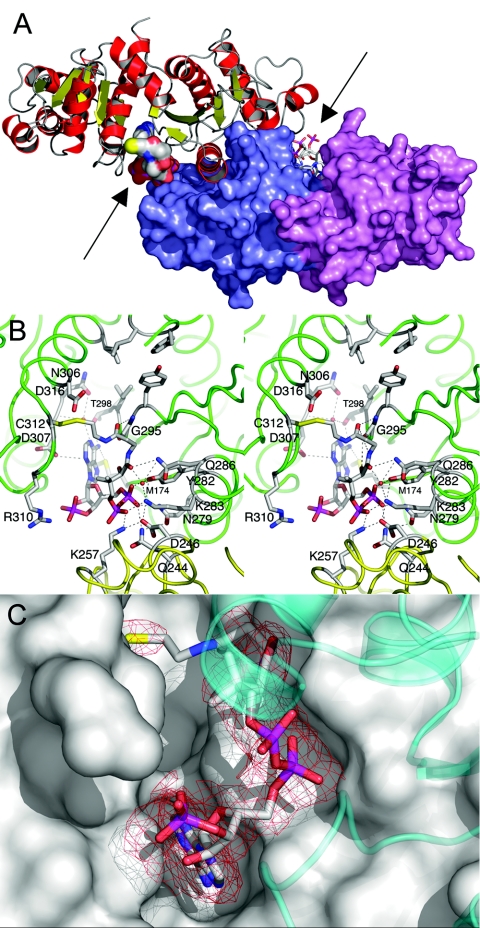
FIG. 2.
Structural features of Pta cocrystallized with CoA. (A) Structure of the Pta dimer. Monomer A is shown in a ribbon representation; α-helices are red, β-strands are yellow, and loops are gray. Monomer B is shown in a surface representation; domain I is violet, and domain II is slate blue. The CoA molecules are shown in a van der Waals representation in monomer A and in a stick representation in monomer B and are indicated by arrows. The view is approximately along the twofold axis of the dimer. (B) Stereo diagram of the CoA1 binding site of monomer A. Monomers A and B (green and yellow, respectively) are shown in a loop representation, and residues involved in hydrogen-bonded interactions with the CoA are labeled. In addition, the proposed catalytic residues Arg310 and Asp316, as well as Cys312, which forms the disulfide linkage with CoA, are labeled. Residues Phe4, Leu5, Tyr294, Ile297, and Ile323 (proposed to interact with the methyl group of acetyl phosphate) are near the top and do not have labels. Hydrogen bonds are indicated by dashed lines. Two water molecules, which mediate interactions between the protein and the cofactor, are indicated by red spheres. (C) Omit electron density map of bound CoA1. The difference omit map is red at a contour level of three times the RMS deviation. Weak density is apparent in the vicinity of the amide group proximal to the sulfur of CoA, presumably due to a lack of interactions between the enzyme and this region of the cofactor. Monomer A is shown in a surface representation, and domain II of monomer B is shown as a transparent cyan ribbon diagram.

