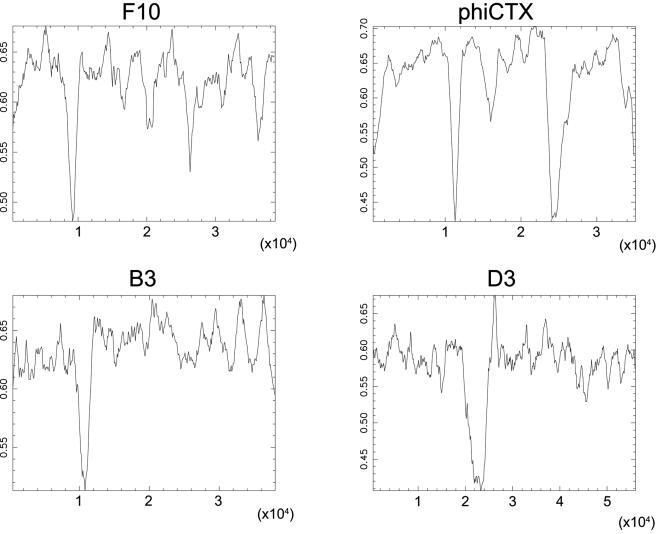
FIG. 1.
Compositional analysis of four P. aeruginosa bacteriophage genomes. The G+C contents (vertical axes) are plotted over the entire length of the sequence (horizontal axes) for phages F10, phiCTX, B3, and D3. The plots were made with the Isochore program of the EMBOSS package with a sliding window size of 500 bp.

