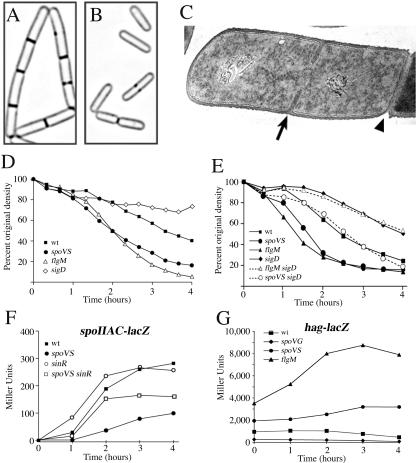
FIG. 3.
Cell separation, autolysis, and Spo0A∼P- and σD-directed gene expression. (A and B) FM 4-64 membrane staining showing the wild type (PY79) growing in chains (A) and spoVS (KP535) growing as single cells (B). (C) Electron micrograph showing a vegetative PY79 cell dividing in the middle (arrow) and still connected to its sister cell by septal peptidoglycan in the progress of being split by autolytic enzymes (arrowhead); samples were prepared as previously described (23). (D and E) Sodium azide-induced autolysis during vegetative growth, measured by taking samples from a growing culture, adding sodium azide to a concentration of 0.05 M, and following the optical density at 600 nm over time at 37°C with continued aeration (3). The wild type (squares), sigD (open diamonds; KP813), spoVS (circles; KP535), and flgMΔ80 (open triangle; KP812) trains sare shown. (E) The following strains are shown: wild type (squares); sigD (filled diamonds; KP813); spoVS (circles; KP535); flgMΔ80 (triangle; KP812), flgM sigD (open triangle; KP829), and spoVS sigD (open circle; KP830). (F) Spo0A∼P-dependent expression of spoIIAC-lacZ in the wild type (squares; KP84), spoVS (circles; KP936), sinR (open circles; KP937), and spoVS sinR (open squares). Samples were harvested at the indicated time after the initiation of sporulation by resuspension at 37°C. (G) σD-directed expression of hag-lacZ during a resuspension sporulation in the wild-type (squares; KP818), spoVG (diamonds; KP823), spoVS (circle; KP821), and flgMΔ80 (triangle; KP819) strains.

