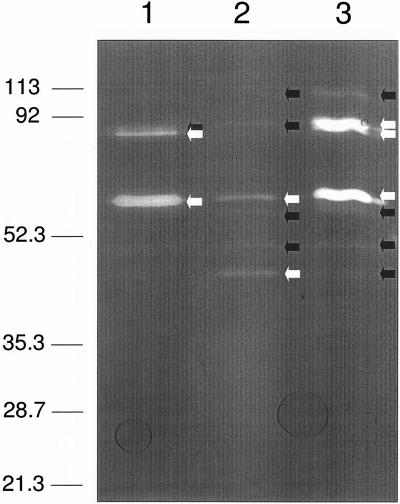
FIG. 4.
Zymogram analysis of autolysins from E. faecalis ATCC 19433 grown to different culture states. Sonicates of equal amounts of cells from mid-exponential-phase (lane 1), stationary-phase (lane 2), and VBNC (lane 3) cultures were loaded into a zymogram gel containing peptidoglycan under basic conditions. The black and white arrows indicate autolytic bands with relatively low and high intensities, respectively.

