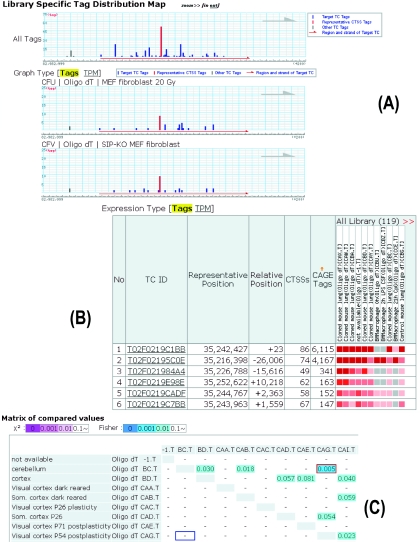
Figure 2.
Screenshots of CAGE Analysis Database: (A) a view of base pair scale expression within a TC, where CAGE tag count of each genome position is displayed in histogram, (B) a view of TC expressions within a TU, in which expression levels are represented by a heat map like representation, (C) a view of statistical significances of expression fluctuations between RNA samples, and their E-values are displayed in a matrix.

