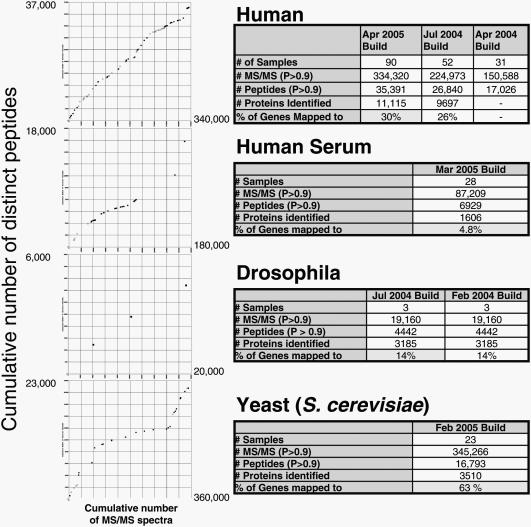
Figure 2.
Plots: cumulative number of MS/MS spectra versus cumulative number of distinct peptides (all spectra and peptides correspond to peptide identifications with probabilities ≥0.9). The figure will show saturation when new spectra do not yield new peptide identifications. Tables: statistics for atlas builds (number of experiments, number of spectra that yielded a peptide identification with probability P ≥ 0.9, number of distinct peptides identified, number of proteins identified and percentage of all genes to which the proteins map).

