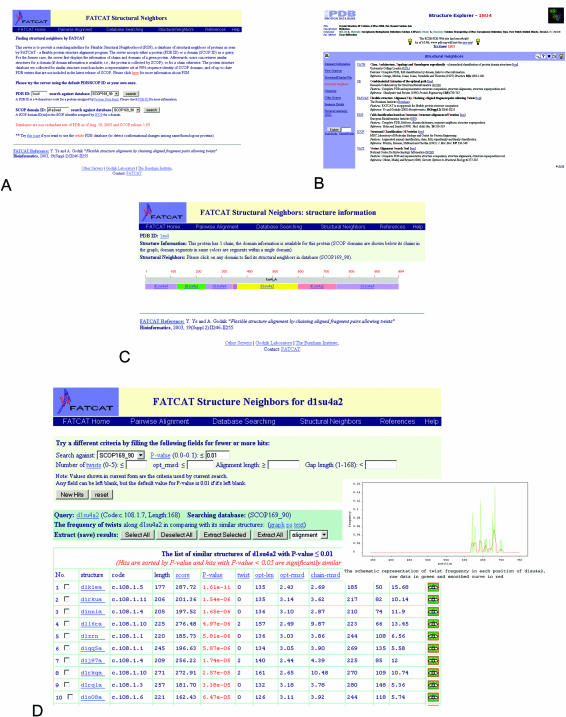
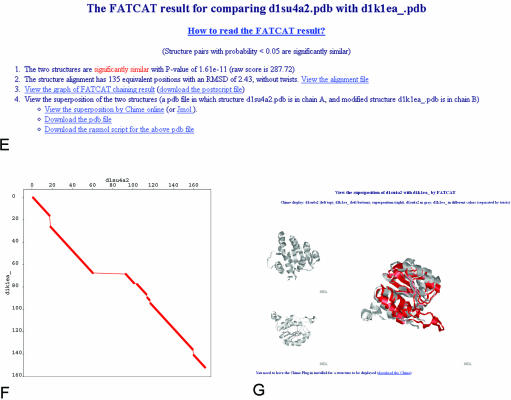
Figure 1.
Workflow at the FSN database website and illustrations of the main result pages. An example of a calcium ATPase (PDB entry 1su4) is used throughout the figure. The query could be initiated directly from the FSN main interface (A) or by following the FATCAT link in PDB structural neighborhood page (B). Both ways lead to the protein summary page, where domain structure of the query protein is summarized and links to structural neighbors for each domain are provided (C). Clicking on each of the domains leads to a FSN page (D), where a list of similar structures is rank-ordered by the statistical significance of the structural similarity. This page provides links to an overall summary of hinge point positions (inset in D) and to FATCAT result pages (E) of each individual alignment. A FATCAT result page provides details of an alignment, and links to the graphical representation of the alignment (F), visualization page of the resulting superposition of input structures (G) and many others (not shown).


