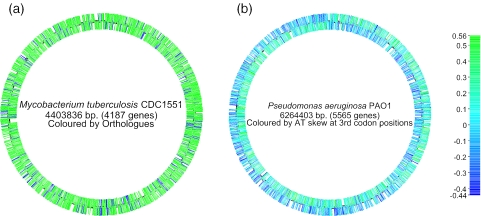
Figure 1.
Whole genome displays generated by xBASE. (a) The genome of Mycobacterium tuberculosis CDC1551 (8), coloured according to the presence (red) or absence (blue) of orthologues in Mycobacterium bovis AF2122/97 (9). This display illustrates the regions of the M.tuberculosis backbone that have been deleted during the evolution of M.bovis. (b) The genome of Pseudomonas aeruginosa PAO1 (10), coloured by AT skew (A−T/A+T) at synonymous third codon positions. This colour scheme reflects an asymmetric mutation bias during chromosomal replication. The ‘switch’ from leading to lagging strand at the origin and terminus of replication can be seen. They are not directly opposite due to a large 2.2 Mb inversion that spans the replication origin of the P.aeruginosa genome.

