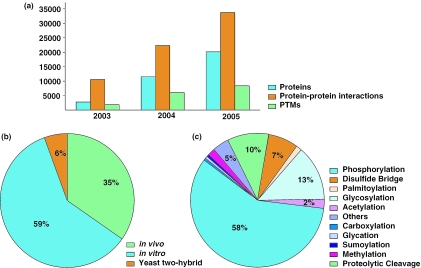
Figure 1.
Statistics pertaining to HPRD growth, experimental types for protein–protein interactions and a breakdown of PTMs. (a) Growth of HPRD over the last 3 years with respect to protein entries, protein–protein interactions and PTMs. (b) Distribution of protein–protein interactions in HPRD based on the type of the experimental method. (c) Distribution of various types of PTMs in HPRD. The percentage of the respective PTM is indicated only when it is greater than or equal to 2.

