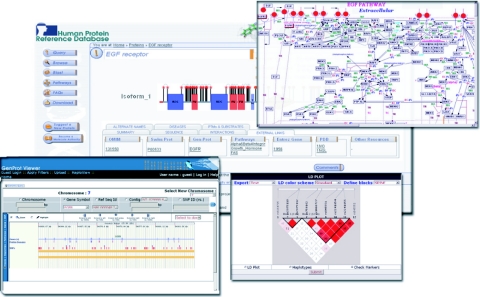
Figure 2.
A screenshot of the molecule page of EGF receptor in HPRD is shown. The molecule page shows a graphical representation of the protein with its protein domains as polygons and sites of phosphorylation as vertical straight lines with red circles at the ends and disulfide bonds represented as gray lines. A link to the GenProt Viewer showing a number of SNPs and exons is shown in the left lower corner. Haploview that shows population haplotype patterns is shown on the lower right corner. The popup on the top right shows the EGF signaling pathway.

