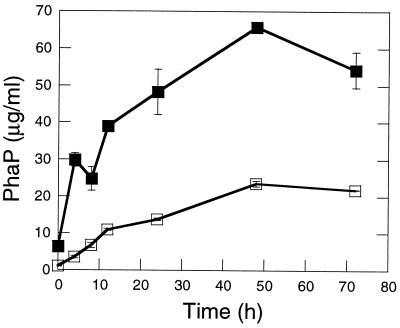
FIG. 5.
Quantitation of PhaP in R. eutropha wt and ΔphaR strains, as cultivated in PHA(high) by high-titer inoculation and as measured over a time course of 72 h. Symbols: open squares, wt strain; solid squares, ΔphaR strain. All datum points represent the average value for two independent cultures. Error bars indicate the standard deviation. Samples correspond to the cultures of wt and ΔphaR strains in Fig. 4A and B.

