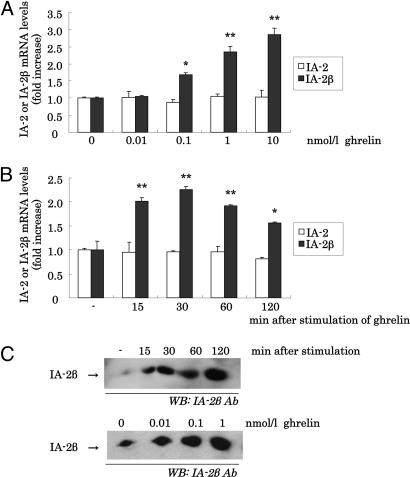
Fig. 2.
Effect of ghrelin on IA-2β expression in MIN6 cells. (A) IA-2 (□) and IA-2β (▪) mRNA expression levels of MIN6 incubated with 0.01, 0.1, 1, or 10 nmol/liter or without ghrelin for 30 min. (B) IA-2 (□) and IA-2β (▪) mRNA expression levels of MIN6 incubated with 1 nmol/liter ghrelin for the indicated times. Data of mRNA expression quantified by QT-PCR are expressed as fold increase relative to the values observed with cells that were nonstimulated by ghrelin. All values are expressed as the means ± SDs of three independent experiments (n = 6–12, *, P < 0.05; **, P < 0.01 vs. nonstimulation with ghrelin). (C)(Upper) IA-2β protein expression levels of MIN6 incubated with 1 nmol/liter ghrelin for indicated times. (Lower) IA-2β protein expression levels of MIN6 incubated with 0.01, 0.1, and 1.0 nmol/liter or without ghrelin for 30 min.

