Fig. 5.
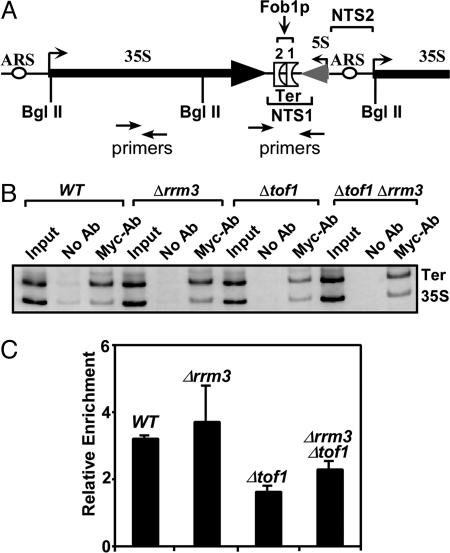
ChIP analysis of fork arrest at the Ter sites in different genotypes. (A) Diagram showing the location of the primer pairs used to amplify Ter-specific and control DNA fragments that were crosslinked to myc-tagged minichromosome maintenance protein (MCM7p) and immunoprecipitated by anti-myc antibodies. (B) A representative photograph of the of the PCR products resolved in a 6% polyacrylamide gel. (C) Quantification of the ratios of the (from three independent sets of experiments) Ter fragment over that of the control fragment. Intensities of the DNA bands were calculated by using an image scanner and the imagequant software of ethidium bromide-stained gels. Computing the ratio of intensity of Ter band over that of the control band and normalizing that by multiplying with the inverse of the corresponding ratio of the input DNA gave the relative enrichment index. The primer pairs used are shown in Supporting Text.

