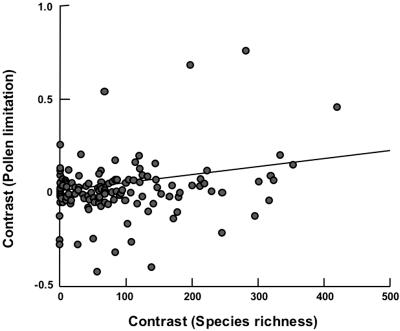
Fig. 4.
Standardized phylogenetic independent contrasts between sister groups descended from the 128 nodes in the hypothesized phylogenetic tree (see Fig. 2). Correlation analysis indicates that increases between sister groups in pollen limitation, measured as the effect size of fruit set, are correlated with increases between sister groups in community species richness (number of heterospecifics in the area) (r = 0.27; P = 0.002). Along the x axis are the positivized contrasts in regional species richness [for instance, the absolute value of the difference between the average regional species richness of Magnoliales (Fig. 2) and the average species richness of its sister group, Laurales], and along the y axis are the corresponding pollen limitation contrasts (continuing with the same example, the difference between the average pollen limitation of Magnoliales and the average pollen limitation of Laurales). The figure shows the slope of the relationship forced through the origin (17).

