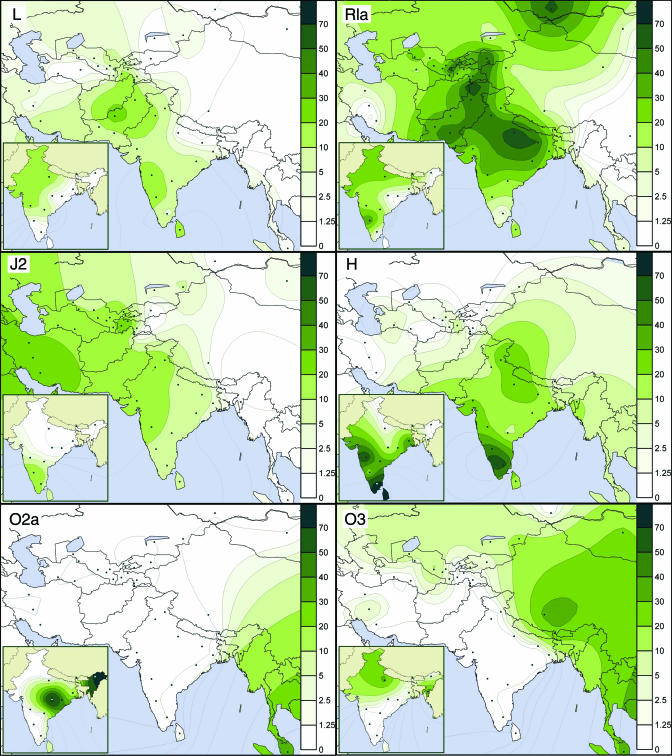
Fig. 2.
Spatial frequency distribution maps of major Y-chromosome haplogroups in South Asia. For India, the data on tribal populations are shown in the inset maps and excluded from the main maps. The data for caste populations are averaged to the level of states in India. Because of different phylogenetic resolution different sets of published data are used for different haplogroup maps.

