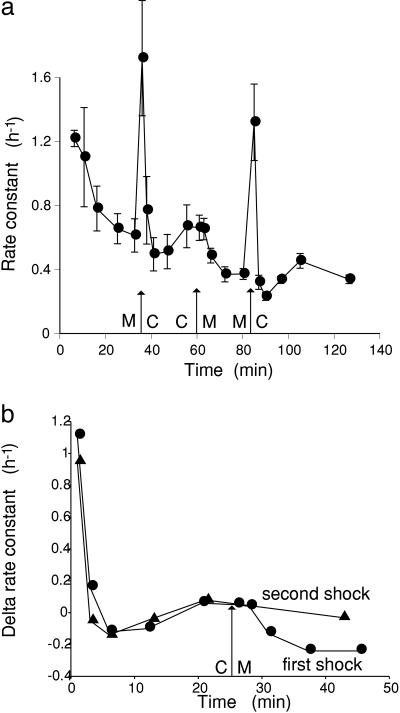
Fig. 2.
Effect of hypoosmotic and hyperosmotic transfers on tracer efflux. (a) Tissue was loaded in the presence of 150 mM mannitol in the bathing solution. After washout for 35 min in the presence of mannitol (M), tissue was transferred to control solution (C) without mannitol for 25 min before being returned to mannitol; after an additional 24 min, a second hypoosmotic shock was applied by again removing mannitol. Rate constant for exchange (rate of loss of tracer/tracer content, in h–1) plotted against time. Each point shows the mean ± SEM of four replicate strips. (b) Comparison of the two hypoosmotic shocks. The delta rate constant, the difference in rate constant from the value before the first shock, is plotted against time after the first hypoosmotic shock. In the first shock, tissue was returned to mannitol at 25 min (arrow), whereas in the second shock, the tissue remained in the hypoosmotic solution. Each point shows the mean of four replicate strips.

