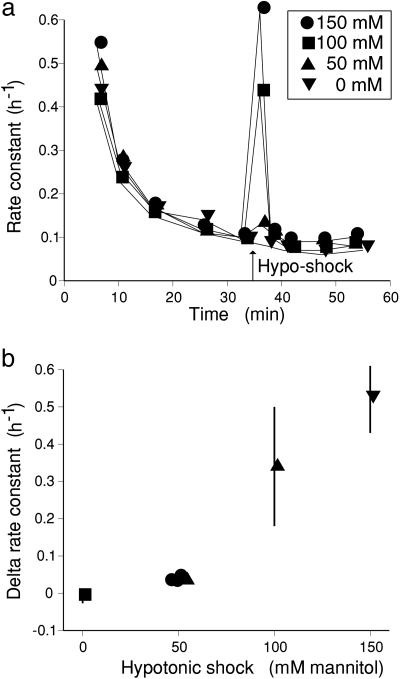
Fig. 3.
Effect of the size of the hypoosmotic shock on the peak rate constant. Tissue was loaded in the presence of 150 mM mannitol and washed out for 35 min in the presence of mannitol. Replicate sets of four strips were then transferred to 0 mM mannitol in 1, 2, or 3 stages or left in mannitol throughout. Transfer sequences in mM mannitol were as follows: 150 to 0, 150 to 50 to 0, and 150 to 100 to 50 to 0. (a) Rate constant for exchange (h–1) plotted against time for the first hypoosmotic transfers for shocks of 150, 100, 50, and 0 mM mannitol. Each point is the mean of four replicate strips. (b) Peak values of delta rate constant (difference from preshock value) plotted against size of hypoosmotic shock. There are four values for shocks of 50 mM mannitol, corresponding to transfers from 150 to 100, 100 to 50, and 50 to 0 (two values). For clarity, errors are not shown for the 50 mM shocks.

